There are multiple places to get started in troubleshooting. This post already covers a few.
App Service Plan Metrics
A first good start is to look at the App Service (single site/service) or App Service Plan (see it as the IIS of old days, combines multiple services) Metrics page and dig into both CPU and memory.
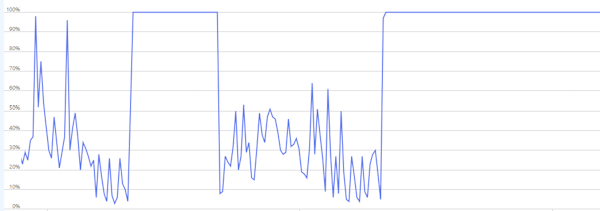
As we can see, there is clearly an issue. However, the question is: is this an application wide problem, or a very specific bottleneck. If you are very lucky and have a well-built system, then you might conclude the load on your system is just too high (e.g. ticket sale) and you can solve it by simply adding more power.
Reality is that most software is not perfect and falls over way sooner than it should be. So let’s dig deeper and split the graphs on instances.
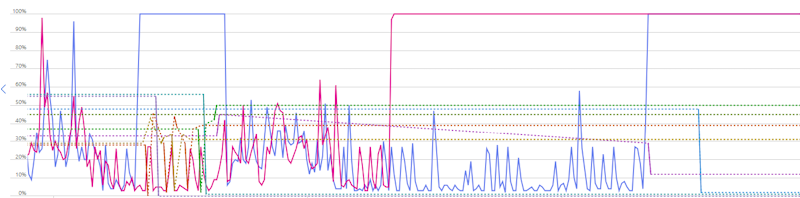
The observations here are:
- Some instances were doing almost no work
- Others were locked at 100% CPU
This is a telltale sign that your load is not evenly distributed. This could be due to:
- Sticky behavior (sessions, caches, warm state): a user keeps returning to the same compute instance to lower performance cost of cache misses etc, but if set up incorrectly then a lot of returning/high load users might be stuck on the same stressed instance while the low load users have plenty of space on another instance.
- Background workloads could bring a single device down.
- Slow dependencies causing thread starvation
- …
Sadly scaling often fix neither of these.
Application insights live metrics
A next step could be jumping down into the live metrics in application insights. This will tell us more on the actual slow calls and dependencies (more on that later) and give you a good overview to do some correlations.
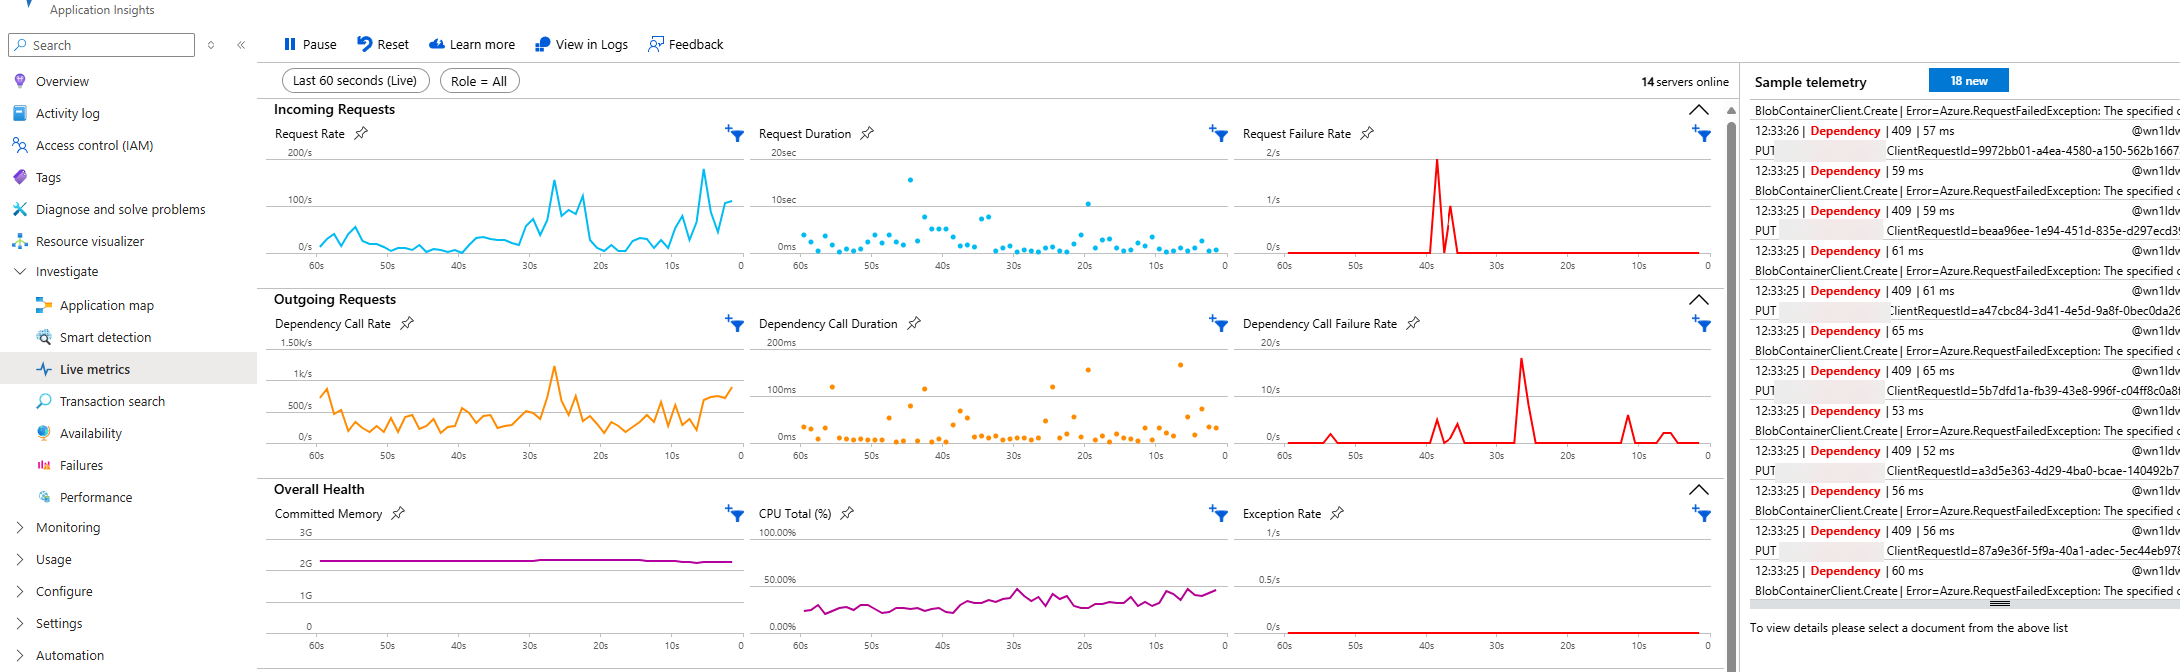
An example correlation could be the increase in incoming requests (between 30s and 20s) resulting in a similar spike in dependency calls, but also duration of those calls and failure rates. This could trigger an investigation into those particular dependencies (e.g. Blob Container issues shown in the telemetry on the right)
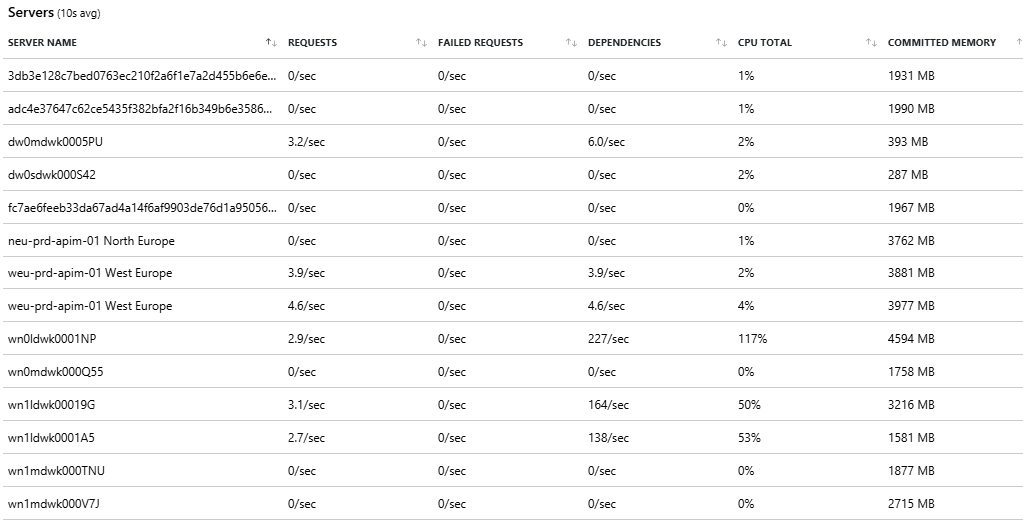
But the page also shows the load per server with a bunch of useful metrics. Combine this with live telemetry and it might already give you some useful insights.